Significant Foreign Direct Investments
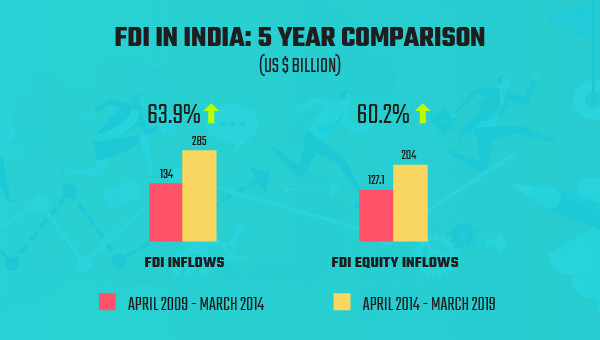
FDI has been on an upward trajectory since 2013-2014. FDI equity inflows have grown by 60.2% between April 2009-March 2014 and April 2014-March 2019. FDI inflows have grown by 63.9% between April 2009-March2014 and April 2014-March 2019.1
Source: 1
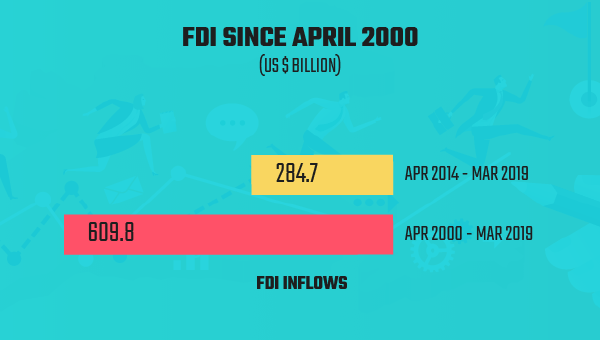
The overall FDI received in the country since April 2000 stands at $609.8 Bn. The FDI inflow from April 2014 to March 2019, values $284.7 Bn. It is 40.7% of the total FDI received since April 2000.
Source: 2
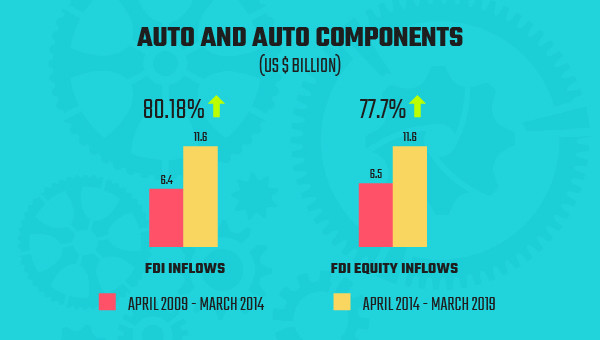
The Auto and Auto Components industry saw an 80.18% increase in FDI inflows - from $6.4 Bn received during April 2009-March 2014 to $11.6 Bn received during April 2014-March 2019.
There was a 77.7% increase in FDI equity inflows between April 2009-March 2014 ($6.5 Bn) and April 2014-March 2019 ($11.6 Bn).3
Source: 3
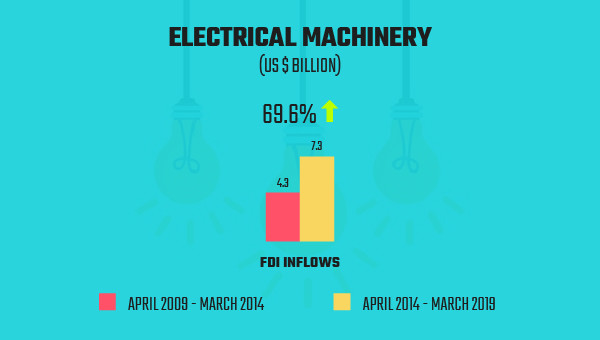
The FDI inflows for the electrical machinery* industry saw a 69.6% increase between April 2009-March 2014 ($4.3 Bn) and April 2014-March 2019 ($7.3 Bn).4
*electrical machinery = industrial machinery + electrical equipment + earthmoving machinery
Source: 4
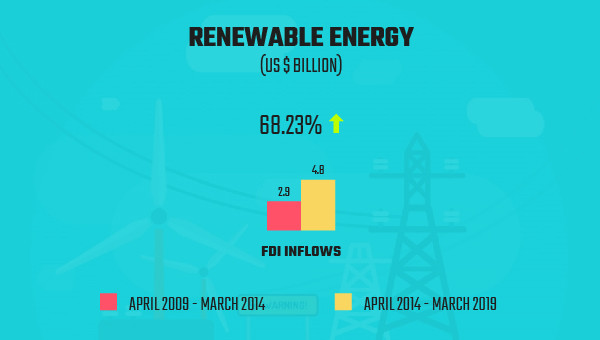
FDI Inflows increased by 68.23% - from $2.9 Bn received between April 2009-March 2014 to $4.8 Bn between April 2014-March 2019.5
Source: 5
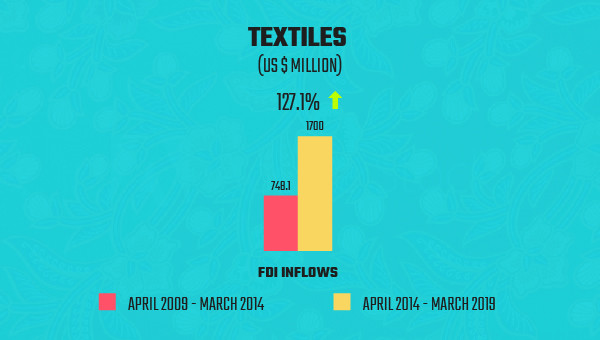
The Textile Industry saw a 127.1% growth in FDI Inflows. The value of FDI Inflows for April 2009-March 2014 stood at $748.1 Mn, and it grew to $1.7 Bn for April 2014-March 2019.6
Source: 6